
Silver’s doomsday math: two U.S. banks short 5.5 years of mine supply as JPMorgan flips long and the bankers turn on each other
and in Silver Mining News - Aya Gold & Silver trades at an average discount of roughly 80% to Coeur, Hecla, and First Majestic on a market-cap-to-annual-silver-production basis

Stat #1.
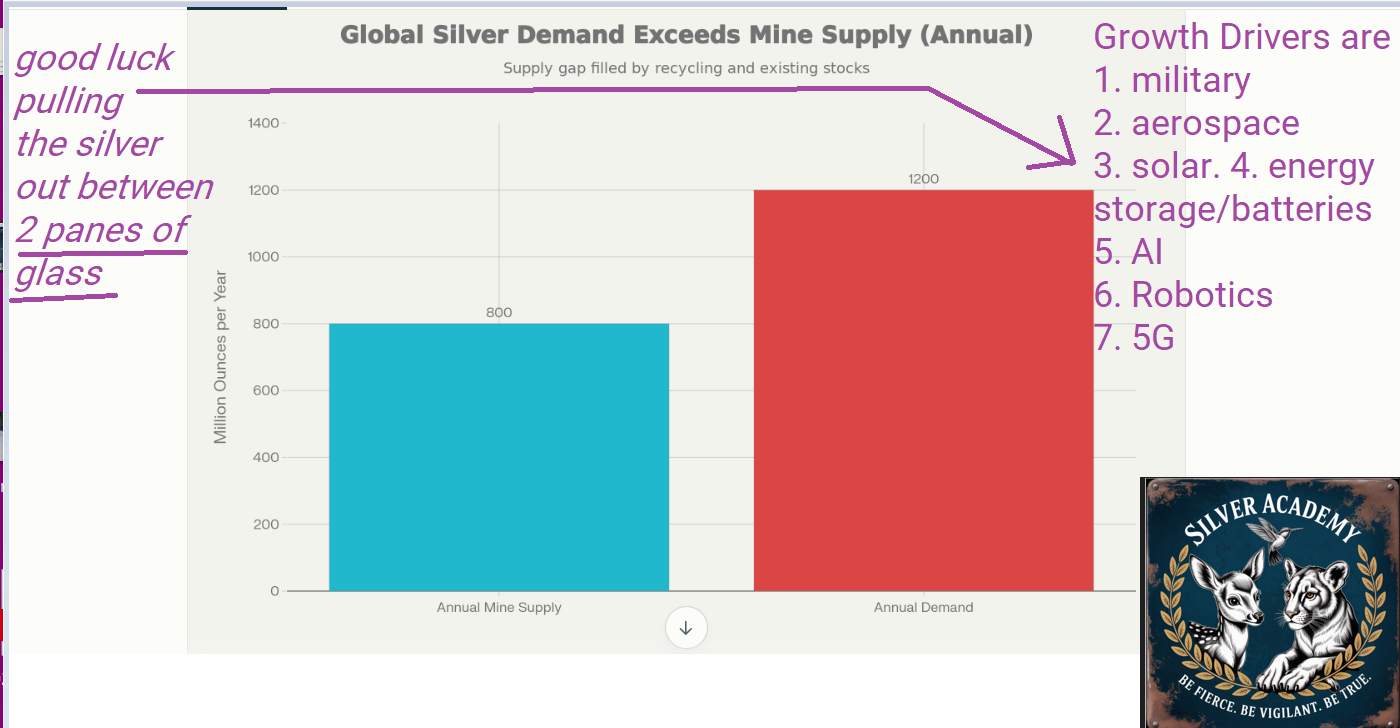
800 million ounces mined per year against growing demand. Just like Eric Sprott recently stated, “They Can’t Supply the Demand”
Recall that the majority of US S&P500 rests on these growth drivers, the magnificent 7 are AI / Tech companies
It all rests on Silver
Stat #2
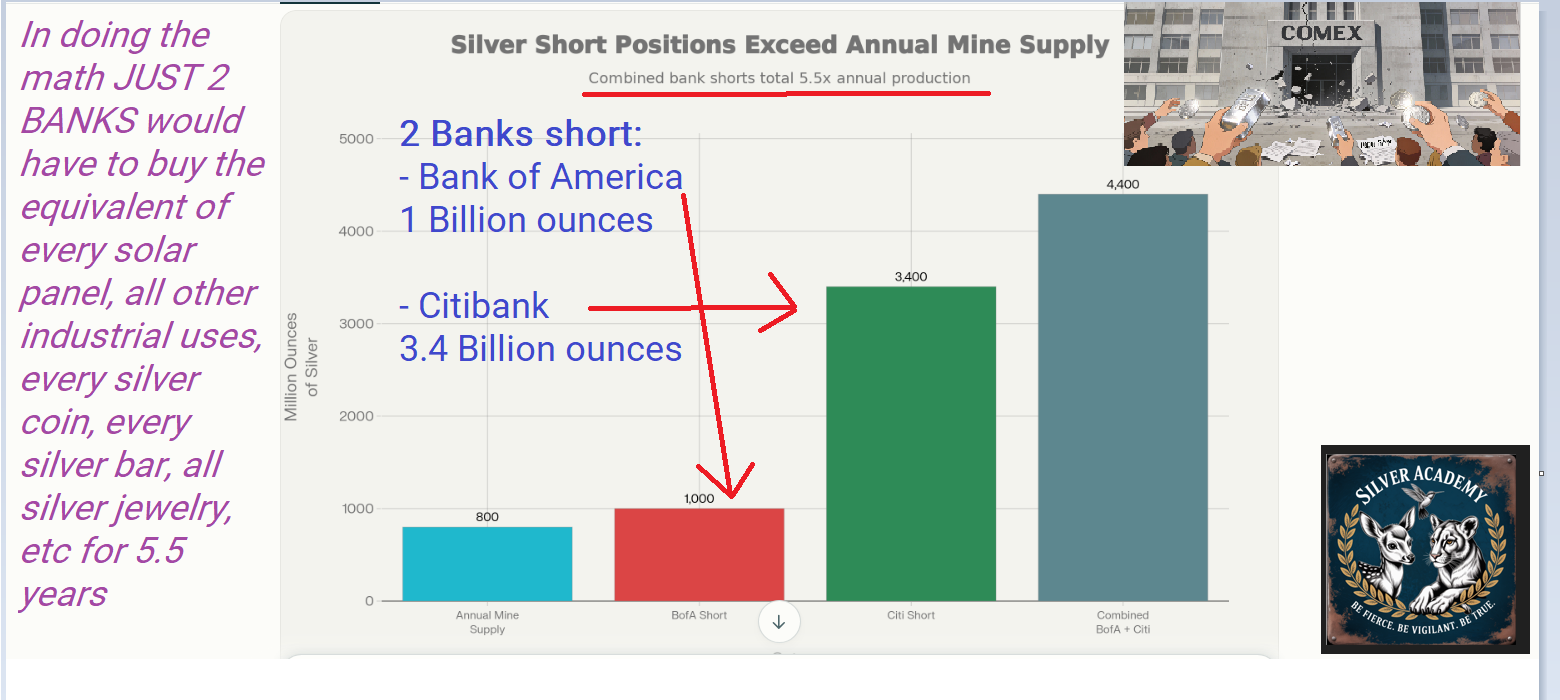
2 banks hold short positions equaling 5.5 years of global mining production
Global banks are running a leverage experiment in silver that only works as long as no one asks for real metal.
The post‑2008 “too big to fail” model has mutated into a game where profits stay in the boardroom and systemic risk is quietly pushed onto everyone else.
Physical reality vs paper games
Global mine production is around 820M ounces a year, while industrial users already consume roughly 680M ounces—over three‑quarters of output.
The residual “free float” for coins, bars, and investment products is far smaller than headline production suggests.
Synthetic and OTC exposure now represents claims on silver that vastly exceed what miners can deliver in any reasonable timeframe.
How banks manufacture “phantom” silver
Unallocated accounts give clients a line item on a statement, not a specific bar in a vault.
The same bar can be lent, swapped, and rehypothecated to multiple counterparties, multiplying claims on a single ounce.
Persistent structural deficits—demand exceeding mine supply plus recycling—are masked by selling paper silver the system does not actually have.
When the music stops
The entire structure assumes everyone will accept cash instead of metal when stress hits.
In a real scramble by a sovereign, a mint, or a major manufacturer, exchanges can simply flip to “cash‑settled only.”
At that point, a two‑tiered market emerges: a managed, irrelevant paper price and a street price for actual bars that rips higher.
India and China understand this yet few in USA understand this (take a look around any graduate school of engineering, math, medicine, architecture … its over 80% Asian, Carnegie Mellon in Pittsburgh, over 90% Asian)
Fractional‑reserve logic, commodity edition
This is fractional‑reserve banking applied to a finite, strategic metal: maximal leverage on the way up, moral hazard on the way down.
Fee income, spreads, and trading profits are privatized, while the eventual fallout—rule changes, broken contracts, and potential bailouts—is socialized.
Anyone holding only paper “exposure” is not a silver owner; they are an unsecured creditor in a system that will choose its own survival over their claims.
The two‑bank time bomb
Two major banks now sit at the center of this powder keg of synthetic metal.
Bank of America is short an estimated 1 billion ounces of silver.
Citibank is short an estimated 3.4 billion ounces of silver.
Combined, that is 4.4 billion ounces—over five times a typical year of global mine supply.
Do the math: at roughly 800M ounces of mine production per year, it would take about 5.5 years of every single ounce mined just to cover these two positions.
That implies:
No jewelry.
No solar panels.
No torpedo batteries
many of these silver batteries use over 11,000 ounces of silver (per battery) like these shown in the “must watch” video below
No tomahawk missiles
No electronics.
No coins or investment products.
Industrial demand already consumes about 60–70% of annual supply, leaving a very small investable surplus.
The effective “free float” of investment‑grade silver is therefore tiny relative to these paper claims.
What all of us know in this room
Global silver isn’t “tight” – it’s on the edge of a historic breakdown. Global mine supply is effectively capped around 820 million ounces a year, yet real-world demand is barreling toward a minimum of 1.2 billion ounces. That is a structural deficit you don’t “trade around” – you survive.
Now bolt this on: two giant banks are effectively short the equivalent of 5.5 years of global mine supply. That means half a decade where every ounce pulled from the ground would need to go just to plug their paper hole – zero left for industry, mints, or investors.
Eric Sprott openly talks about silver heading toward $300 dollars an ounce, and if anyone on this planet has earned the right to make that call, it’s him.
Meanwhile, the U.S. quietly labels silver a “critical mineral”… and now China starting effectively tomorrow states they are not exporting Silver.
We are all understanding why Miners are the 2026 play, especially considering how massively over-weighted Tech stocks are now.
Aya Gold and Silver
Check out these next two charts and we will also break down what this means for stock value.
disclaimer, we did some transposing from a slide deck to extrapolate further
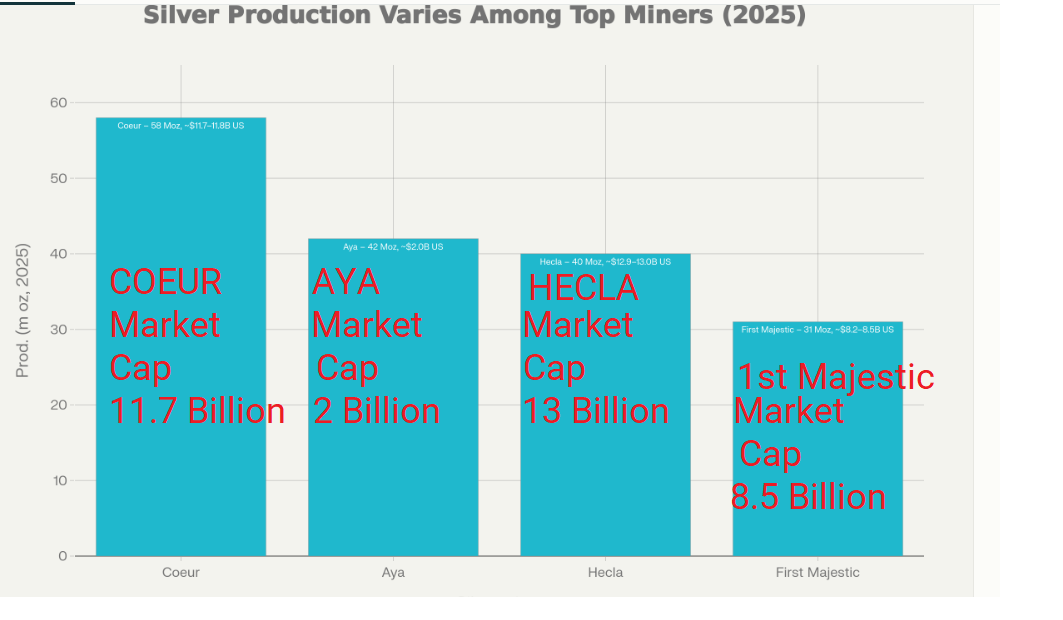
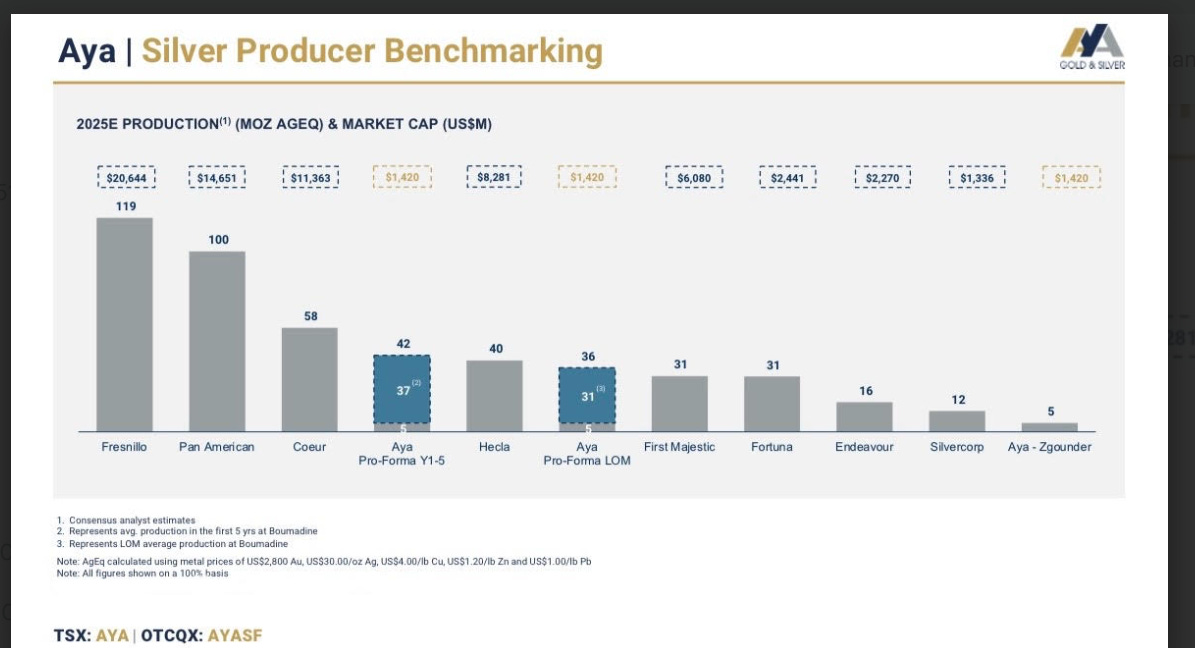
silver production for four major silver miners (million ounces)
Coeur: 58 million oz
Aya: 42 million oz , infers Boumadine production which is now permitted and funded
Hecla: 40 million oz
First Majestic: 31 million oz
Market caps for those same 4 miners (USD)
Coeur Mining (CDE): about $11.7–11.8 billion market cap.
Aya Gold & Silver (AYA / AYASF): about $2.0 billion market cap.
Hecla Mining (HL): about $12.9–13.0 billion market cap.
First Majestic Silver (AG): about $8.2–8.5 billion market cap.
Aya Gold & Silver looks dramatically undervalued versus Coeur, Hecla, and First Majestic on a “market cap per ounce produced” basis using 2025 production and market cap figures. Understanding that some companies’ figures are inferred, while others are reported under customary, standard disclosure practices.
Output per market cap dollar
Aya will produce 42 Moz with a ~$2.0B market cap, or about 21.0 Moz per $1B of market value.
Coeur produces 58 Moz with an ~$11.7–11.8B market cap, or about 4.9–5.0 Moz per $1B, meaning Aya delivers over 4x as many ounces per $1B of market cap as Coeur.
Hecla produces 40 Moz with a ~$12.9–13.0B market cap, or about 3.1 Moz per $1B, so Aya offers roughly 6.5–7x the ounces per $1B of market value versus Hecla.
First Majestic produces 31 Moz with an ~$8.2–8.5B market cap, or about 3.6–3.8 Moz per $1B, so Aya delivers about 5.5–6x the ounces per $1B of market cap compared with First Majestic.
these numbers are merely calculated by staff interns and if there are any typing errors we will resolve them weekly.
Implied “parity” valuations
If Aya were valued at Coeur’s market cap per ounce, its 42 Moz would imply roughly a $8.4–8.8B market cap instead of ~$2.0B.
At Hecla’s market cap per ounce, Aya’s 42 Moz would imply roughly $10.8–11.3B.
At First Majestic’s market cap per ounce, Aya’s 42 Moz would imply roughly $8.8–9.4B.
Undervaluation in percentage terms
Versus Coeur’s valuation per ounce, Aya’s current ~$2.0B implies it trades at roughly 75–80% below the “parity” level.
Versus Hecla’s valuation per ounce, Aya trades about 80–82% below that implied parity level.
Versus First Majestic’s valuation per ounce, Aya trades around 77–79% below the implied parity level.
Let’s hear from Mr. Benoit La Salle (Aya Gold and Silver’s CEO) on this topic plus what’s going on with Boumadine (their next massive Silver project)
end of segment
our opinions are not our sponsors opinions
editorial department is separate from promotions department
not financial advice