


1971 to 1980, 1999 to 2011: 2024 and What's Next for Gold and Silver Using Math
Gold's Historic Bull Runs: Charting a Path to $43,254 per ounce Amidst Geopolitical Tensions and Economic Uncertainty


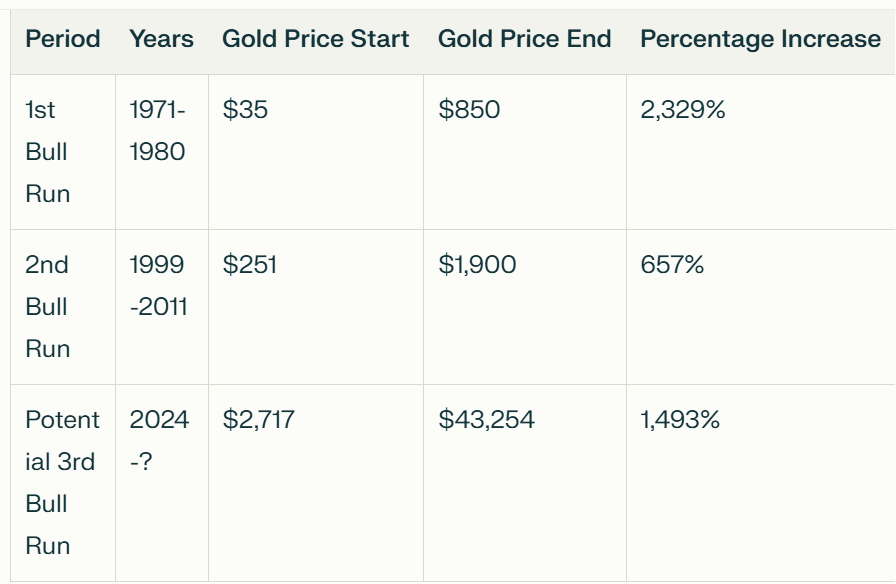
First Gold Bull Run: 1971 to 1980
Lowest price in 1971: $35 per ounce
Highest price in 1980: $850 per ounce (January 1980)
Percentage climb: 2,329%
This bull run began when President Nixon closed the gold window on August 15, 1971, ending the gold standard.
The price surge was driven by high inflation, political turmoil, energy crises, and economic instability.
The largest price run within this period occurred from November 1978 to January 1980, with a 329% increase in just 13 months.
Second Gold Bull Run: 1999 to 2011
Lowest price in 1999: $251 per ounce (August 1999)
Highest price in 2011: $1,900 per ounce (September 2011)
Percentage climb: 657%
This bull run coincided with several major events, including the dot-com bubble burst, the 9/11 terrorist attacks, and the 2008 global financial crisis.
The price increase was fueled by economic uncertainties, loose monetary policies, and growing concerns about U.S. and global debt levels.
In inflation-adjusted terms, gold rose 425% over 145 months during this period.
Both bull runs demonstrate gold's role as a safe-haven asset during times of economic and geopolitical uncertainty.
The dramatic price increases in these periods highlight gold's potential for significant appreciation during times of crisis or instability in the global financial system.
The gold market has indeed entered a new phase after a period of consolidation from 2011 to 2024. This breakout to all-time highs is supported by several significant factors:
Central banks are accumulating gold at record levels, with 290 tonnes added in Q1 2024 alone.
This unprecedented demand reflects growing concerns about global economic stability and the need for a reliable store of value.
Gold's utility is expanding beyond traditional roles. It's now crucial in aerospace applications, protecting space stations and satellites from laser attacks. Additionally, gold is being used to coat quantum computing components, further increasing its industrial demand.
The absence of significant new gold discoveries, coupled with increasing demand, is creating supply pressure.
This scarcity will support much higher prices in the long term.
Geopolitical tensions are escalating, with the US-Russia conflict potentially approaching nuclear confrontation and China intensifying its stance on Taiwan.
These factors drive investors towards safe-haven assets like gold.
The financial sector is facing multiple challenges, including bank collapses, the looming commercial real estate crisis, and record unrealized losses.
These issues, combined with record US debt levels, are eroding confidence in traditional financial systems.
The BRICS nations' move to use gold for oil transactions is a game-changer, potentially accelerating the de-dollarization trend.
Saudi Arabia's exit from US dollar exclusivity further undermines the dollar's global dominance.
These factors collectively paint a bullish picture for gold, suggesting that the current breakout could be the beginning of a sustained upward trend in the precious metal's value.
3rd Bull run takes Gold to $43,254 per ounce (just math doin’ its mathin’)
The current gold price today is $2,717 per ounce. This price reflects the most up-to-date information and differs from the previously mentioned figures.
Gold prices can be volatile and change rapidly due to various factors such as market conditions, economic indicators, and geopolitical events.
Given this current price of $2,717 per ounce, let's recalculate the potential target for the third gold bull run based on the average percentage increase from the previous two bull runs:
Average percentage increase: 1,493%
Target price calculation: $2,717 x (1 + 14.93) = $43,254.81 per ounce
Therefore, using the current price of $2,717 and applying the average increase from previous bull runs, the hypothetical target for a third gold bull run could be approximately $43,255 per ounce.

What about Silver?
The silver price calculation (60:1 ratio) applied to the potential 3rd bull run's projected gold price of $43,254, results in a silver price target of $720.90 per ounce.
Pro Tip
Convert your fiat paper debt notes to real money (Gold and Silver)
Visit SprottMoney.com to get started
